Quickstart
Install
$ pip install tableone
See installation document for more information.
Run demo
The easiest way to understand what this package does is to evaluate it on data.
This Google Colaboratory Notebook is an executable document that allows you to explore tableone. At a high level, you can use the package as follows:
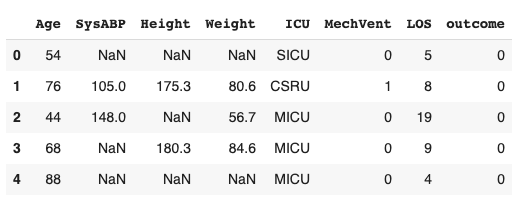
Import the data into a pandas DataFrame
Run tableone on this dataframe to output summary statistics
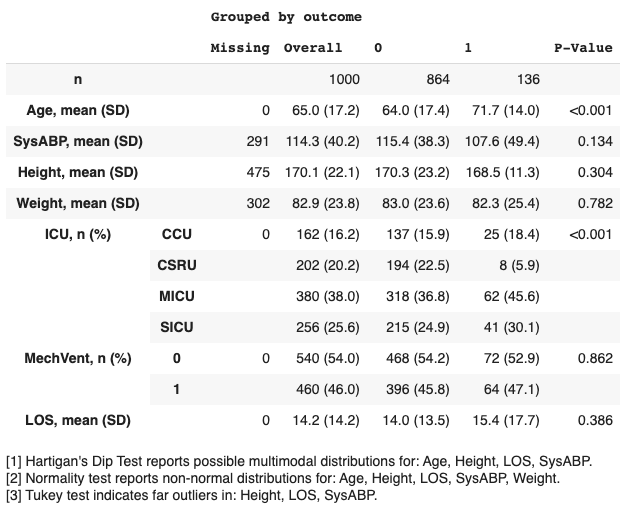
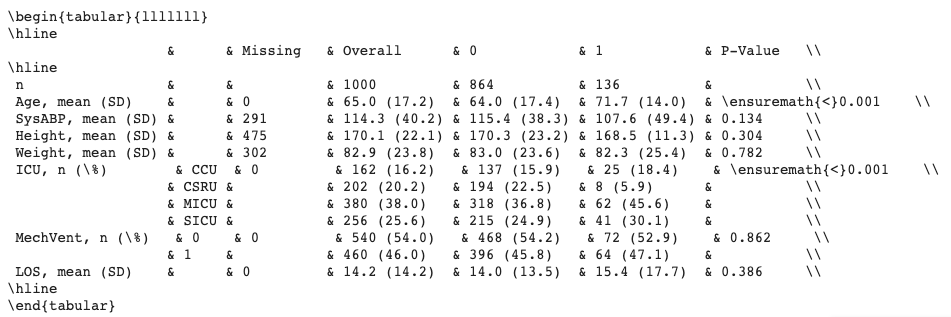
Specify your desired output format: text, latex, markdown, etc.
Additional options include:
Select a subset of columns.
Specify the data type (e.g. categorical, numerical, nonnormal).
Compute p-values, and adjust for multiple testing (e.g. with the Bonferroni correction).
Compute standardized mean differences (SMDs).
Provide a list of alternative labels for variables
Limit the output of categorical variables to the top N rows.
Display remarks relating to the appopriateness of summary measures (for example, computing tests for multimodality and normality).
Suggested citation
If you use tableone in your study, please cite the following paper:
Tom J Pollard, Alistair E W Johnson, Jesse D Raffa, Roger G Mark;
tableone: An open source Python package for producing summary statistics
for research papers, JAMIA Open, Volume 1, Issue 1, 1 July 2018, Pages 26–31,
https://doi.org/10.1093/jamiaopen/ooy012
Download the BibTex file from: https://academic.oup.com/jamiaopen/downloadcitation/5001910?format=bibtex
Example
Import libraries:
from tableone import TableOne
import pandas as pd
Load sample data into a pandas dataframe:
url="https://raw.githubusercontent.com/tompollard/data/master/primary-biliary-cirrhosis/pbc.csv"
data=pd.read_csv(url)
Optionally, a list of columns to be included in Table 1:
columns = ['age','bili','albumin','ast','platelet','protime',
       'ascites','hepato','spiders','edema','sex', 'trt']
Optionally, a list of columns containing categorical variables:
categorical = ['ascites','hepato','edema','sex','spiders','trt']
Optionally, a list of columns containing continuous variables:
continuous = ['age','bili','albumin','ast','platelet','protime']
Optionally, a categorical variable for stratification and a list of non-normal variables:
groupby = 'trt'
nonnormal = ['bili']
Create an instance of TableOne with the input arguments:
mytable = TableOne(data, columns, categorical, continuous, groupby, nonnormal)
Display the table using the
tabulatemethod. Thetablefmtargument allows the table to be displayed in multiple formats, including “github”, “grid”, “fancy_grid”, “rst”, “html”, and “latex”.:print(mytable.tabulate(tablefmt="github"))
Compute p values by setting the
pvalargument to True:mytable = TableOne(data, columns, categorical, groupby, nonnormal, pval=True)
Tables can be exported to file in various formats, including LaTeX, CSV, and HTML. Files are exported by calling the
to_formatmethod on the DataFrame. For example, mytable can be exported to an Excel spreadsheet named ‘mytable.tex’ with the following command:mytable.to_latex('mytable.tex')